Quantitative Understanding of the Trickle-Down Hypothesis (Amazon Kindle)
We obtained quantitative result that is the exact opposite of the trickle-down hypothesis.
For studying trickle-down, we performed an estimation of the circulation of the money flow only between business and households. Business is divided into small, middle, and large companies, and households are divided into low-, middle-, and high-income earners. In this estimation, we obtained numbers of small and middle companies that a high-income earner needs for trickle-down. Free parameters of our estimation are the income ratio and the number ratio of the low-, middle-, and high-income earners in a large company.
As a result, the larger the income ratio is, the more companies the high-income earner needs for trickle-down. This makes trickle-down difficult in the modern economy. This tendency quantitatively denies the trickle-down hypothesis that `if the wealthy become more rich, people obtain benefit via consumption by the wealthy.'
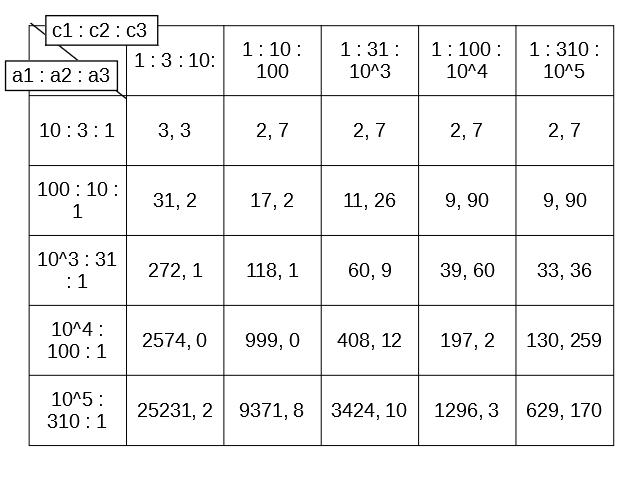
In this table, (a1: a2: a3) indicates the income ratio of the high-, middle-, and low-income earners, and (c1: c2: c3) indicates the number ratio of the high-, middle-, and low-income earners in a large company. A criterion for judging the magnitude of these numbers is 104 days, the number of days per year on Saturday and Sunday.
===
Table of Contents
Chapter 1 Introduction
Chapter 2 Estimation
2.1 Outline of our estimation
2.2 An example of estimation
2.3 Parameter survey
2.4 Directors of real large companies
Chapter 3 Discussion
3.1 Dysfunction of trickle-down
3.1.1 Ideal, time, and reality
3.1.2 Temporal limit
3.1.3 A psychological barrier
3.1.4 High-income earners = vulnerable consumers
3.2 Improvement of our estimation model
3.2.1 Introduction
3.2.2 Other economic agents
3.2.3 Diversification of our company model
3.3 The analogy of a glass tower and wine
3.4 Real money flow
Chapter 4 Summary
References


No comments:
Post a Comment