Friday, December 16, 2022

Growth rate of money circulation velocity V

The subject of this article is the relationship between the average growth rate of the money circulation velocity, V, and that of government expenditure, G. The figure below shows a distribution of average values for about 20 years in 33 countries. The average growth rate of G ranges from 2% to 10%, and the average growth rate of V ranges approximately less than 1% (one example is larger than 2%). In the past 20 years, it is concluded that "the growth rate of circulation velocity V is smaller than the growth rate of government expenditure G". This explains a direct proportional relationship between the growth rate of nominal GDP and the growth rate of G.

The x-axis shows the averaged growth rate of G, and the y-axis show the averaged growth rate of V.


Our purpose for this article is to explain the direct proportional relationship between the growth rate of G and the growth rate of nominal GDP, as is shown in our previous article, "A relationship between nominal GDP growth rate and  government spending growth rate." 

In that article, the author showed that this direct proportional relationship can be explained under the money circulation, if the growth rate of V is equal to 0, and if the growth rate of G is equal to the growth rate of domestic investment, I. The above figure shows that the growth rate of V is small compared to the growth rate of G. This leads to the above direct proportional relationship.

Sunday, December 11, 2022

Direct benefits lead to PQ=C+G'+I < C+G+I=C+T+S

As a conclusion of this article, under the fluid picture of money circulation, direct benefits (monetary assistance, or cash handout) lead to "PQ ≠ C+G+I''. Here an instance of direct benefits is monetary assistance during this covid-19 disaster. For measuring GDP, we should apply Y=C+G'+I=PQ, where G' is obtained by subtracting the budget for direct benefits from G.


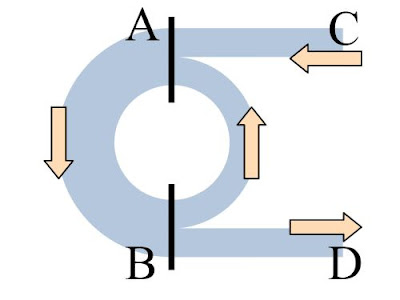
A fluid picture of money circulation. The goods and services market is located in `A', and the household budget is located in `B'. `C' and `D' are government and financial markets.

Sunday, August 28, 2022

Temporal evolutions of three growth rates of M, V, and nominal GDP

In a previous article, "A three-piece set for understanding the money circulation", we introduced two formulations of money circulation, M=G+I and V=1/(1-β). In another previous article, "A relationship between nominal GDP growth rate and  government spending growth rate", we introduced a relationship between the above two growth rates. In this article, we show temporal evolutions of three growth rates on M, V, and nominal GDP (Y).

Growth rate of nominal GDP and growth rate of M=G+I
Growth rate of nominal GDP (y-axis) and growth rate of M=G+I (x-axis).

This plot shows growth rates of M=G+I and nominal GDP. These growth rates are directly proportional with some variance. Under the flow of money circulation, magnitude of M=G+I determines magnitude of nominal GDP. This is a causal relationship.

From this result, we can conclude that the low growth rate of Japanese GDP in recent years comes from the low growth rate of M=G+I.


Contents.

Friday, July 1, 2022

A fluid view of money circulation

In this article, we describe money circulation in a fluid sense.

The figure below shows a waterway of money circulation. We expect that this attempt help scientists and engineers, who are familiar with fluid-dynamics and electronic circuits, understand the money circulation. It is easier to understand temporal evolution of money circulation via this image.

A fluid-like money circulation.

Monday, May 16, 2022

A relationship between nominal GDP growth rate and government spending growth rate

Contents.

  1. A relationship.
  2. Our derivation.
  3. dV/V=0 and M=aG.


1. A relationship

Our motivation on this article is the following relation.

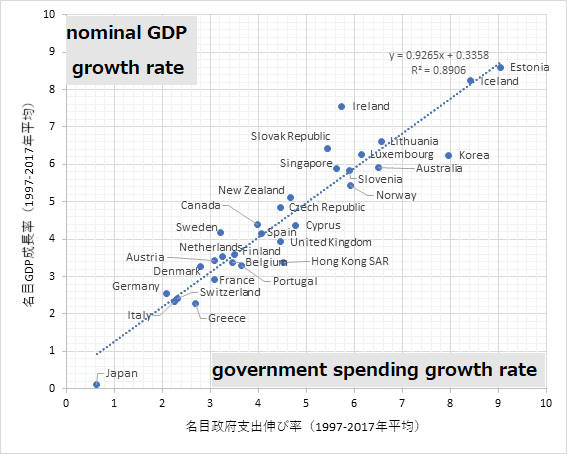
A relationship between nominal GDP growth rate and  government spending growth rate.

This figure shows a relation of growth rates between nominal GDP and government spending. Data is of 31 countries, and is 20-years averaged. This figure shows very impressive relation. Growth rates of nominal GDP (y-axis) is proportional to those of government spending (x-axis). Ranges of x- and y-axes are from 0% to 10%.

Wednesday, May 4, 2022

An integration of GDP definitions and an extension of the quantitative equation

In a previous article, 'A three-piece set for understanding the money circulation', we explain a quantitative view of the money circulation via our 3-piece set, the circular flow diagram, a definition of nominal GDP, and the quantity equation (Fisher's equation of exchange).

In this article, we introduce an integration of definitions of GDP and an extension of the quantitative equation. These are logical consequences from the quantitative view of the money circulation. The contents of this article are as follows.


  1. An integration of GDP definitions.
  2. An extension of the quantity equation.

Monday, April 25, 2022

A three-piece set for understanding the money circulation

In this article, we introduce a three-piece set for grabbing the money circulation. The three-piece set is the circular flow diagram, a definition of nominal GDP, and the quantity equation (Fisher's equation of exchange). These items are independent in the modern economics. We integrate them for the money circulation. As a conclusion, we obtain M=G+I=S+T and V=Y/(G+I).


The contents of this article are as follows.

Featured Post

Temporal evolutions of three growth rates of M, V, and nominal GDP

In a previous article, " A three-piece set for understanding the money circulation ", we introduced two formulations of money cir...

Popular Posts